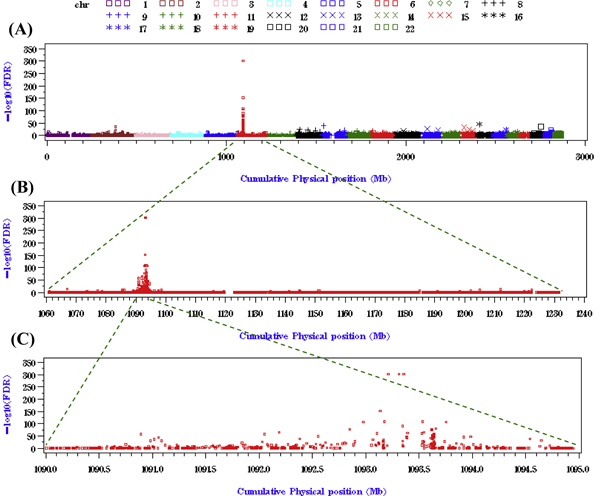
Figure 1.

Genome-wide gene-based association mapping of RA data. The horizontal axis denotes the physical position of SNPs (scale in Mb) and the vertical axis denotes the FDR-adjusted p-values (scale in -log10). A, FDR-adjusted p-values (scale in -log10) of genome-wide gene-set association tests; B, Association signals on chromosome 6; C, Association signals on a chromosomal region between 1,090 Mb and 1,095 Mb (in cumulative physical position).
