
Figure 1.
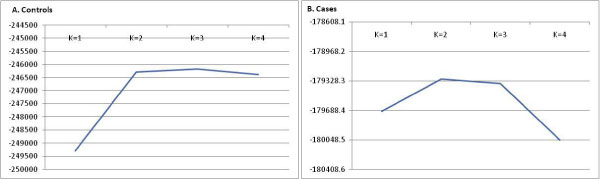
Likelihood of data under number of hidden populations (K) estimated separately for controls (A) and cases (B). K denotes number of populations.
Official websites use .gov
A
.gov website belongs to an official
government organization in the United States.
Secure .gov websites use HTTPS
A lock (
) or https:// means you've safely
connected to the .gov website. Share sensitive
information only on official, secure websites.
Likelihood of data under number of hidden populations (K) estimated separately for controls (A) and cases (B). K denotes number of populations.