
Figure 1.
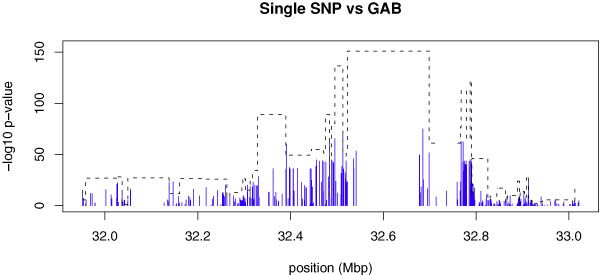
A comparison of haplotype and individual association tests on HLA region. -Log10 transformed p-values are plotted across chromosomal location 32 Mbp to 33 Mbp. The results from individual association tests are represented by solid blue sticks; the results from haplotype association tests with GAB blocks are represented by dotted black lines.