
Figure 1.
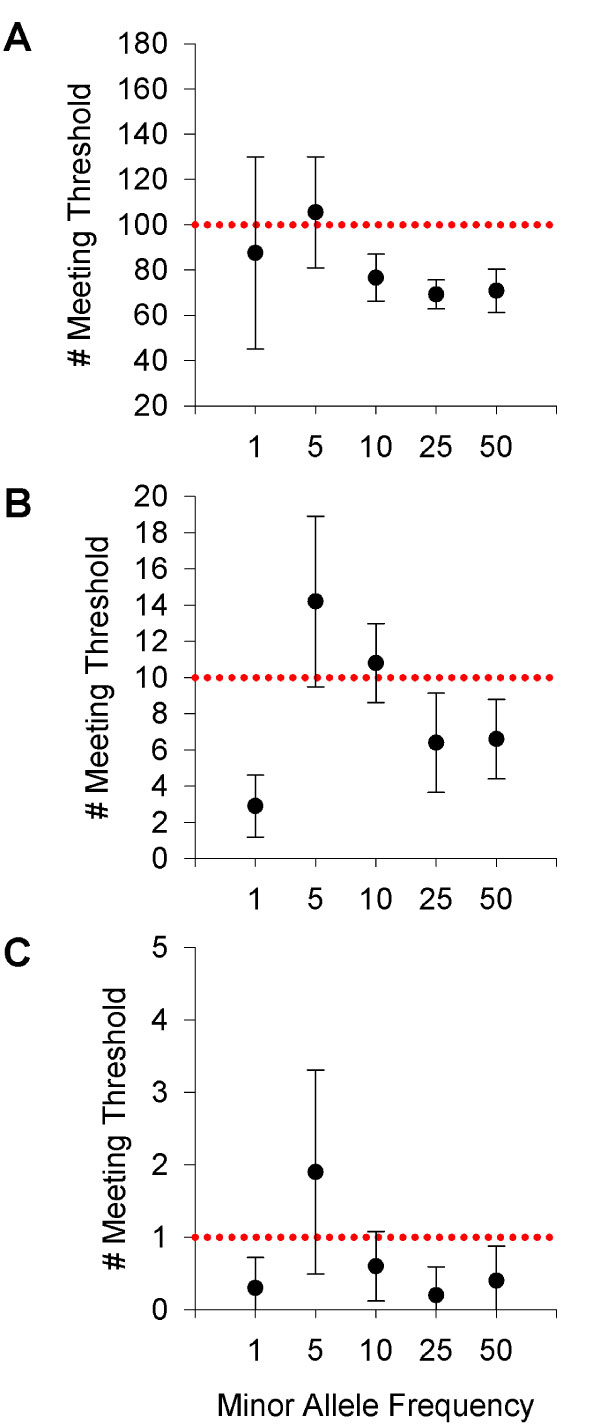
Permuted runs reaching significance. Means ± 95% confidence intervals of number of permuted runs reaching significance at α ≤ 10-4 (Panel A), α ≤ 10-5 (Panel B), and α ≤ 10-6 (Panel C). The dotted line in each panel represents the expected number of significant tests expected by chance.