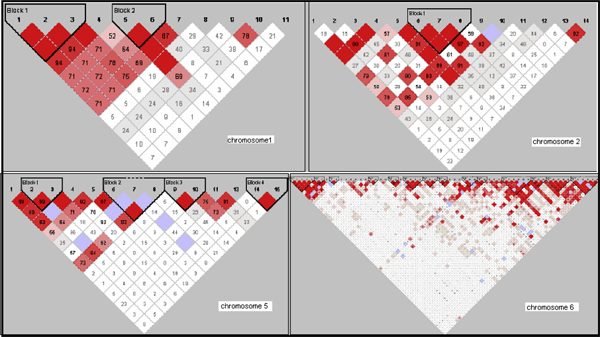
Figure 1.

LD block structure across the chromosomal regions used in this study. The figures show the output of Haploview (version 3.32) LD Plot where each square (with D' values written within the box) represents a pair-wise LD relationship between the two SNPs. Red squares indicate statistically significant LD between the pair of SNPs as measured by the D' statistic. Darker colors of red indicate higher values of D', up to a maximum of 1. White squares indicate pair-wise D' values <1 with no statistically significant evidence of LD.
