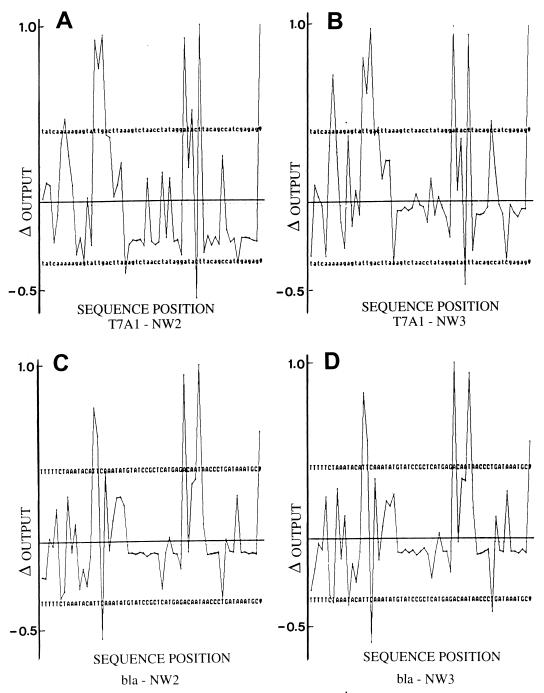
Figure 1.
Promoter profiles generated by differentiating two promoter-trained networks. The y axis value represents the relative decrease in the network output value of the first output neuron for a 5% decrease in the input weight associated with that particular position (base) on the x axis; negative values would correspond to an increase in the network output value. All values have been normalized to the Δ maximum for each set of data, defined as 1.0. in A. For T7A1 in NW2, the output value was 0.992433; the Δ maximum for any position was 0.000121. (B) For T7A1 in NW3, the output value was 0.996465; the Δ maximum was 0.0000217. (C) For bla in NW2, the output value was 0.9850; the Δ maximum was 0.000338. (D) For bla in NW3, the output value was 0.963631; the Δ maximum was 0.00372.

