
Figure 1.
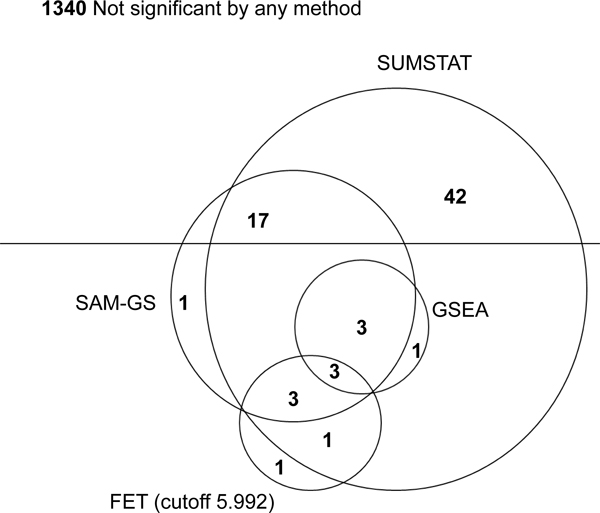
Venn diagram of sets identified as significant by four different GSA methods for Framingham Heart Study data. The numbers represent the significant sets in each non-overlapping region. Total number of sets depicted is 1412, which is 706 gene sets for each of the two phenotypes. There were 1340 sets not identified as significant by any method.