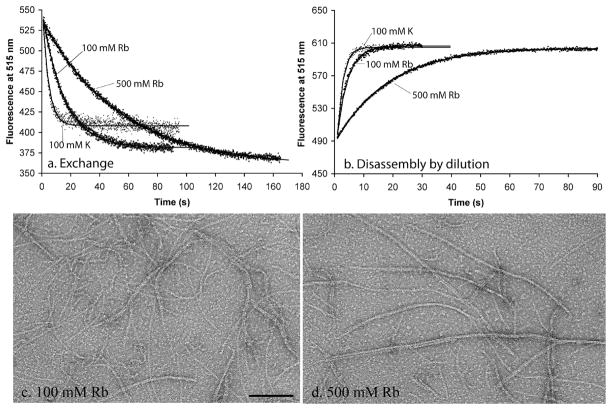
Figure 4.
Dynamics of FtsZ in 100 and 500 mM rubidium buffers, compared to 100 mM potassium, (a) Subunit exchange at steady state. Fluorescence values were normalized to that in 100 mM KAc at time zero, (b) Disassembly induced by dilution. (c and d) Negative stain EM of filaments assembled in rubidium. The bar is 100 nm.

