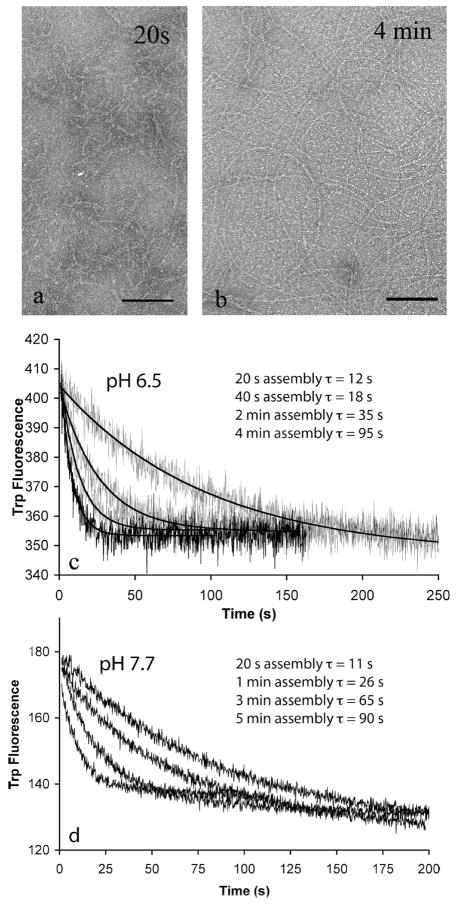
Figure 7.
Annealing of FtsZ-L68W filaments assembled in EDTA buffer (pH 6.5 and pH 7.7 buffers). The FtsZ concentration was 6 μM in all experiments. (a and b) At pH 6.5 (MEK100), EM shows longer filaments after assembly for 4 min than after 20 s. Filaments were mostly one-stranded, and some formed circles ~250 nm in diameter. The bar is 100 nm. (c) Disassembly of FtsZ-L68W filaments induced by dilution following different periods of assembly and annealing in MEK100 buffer (pH 6.5). From left to right, the curves show disassembly induced by dilution 20 s, 40 s, 2 min, and 4 min after assembly had been initiated by addition of 0.5 mM GTP. The solid lines are the fits to the single-exponential decay. (d) Disassembly induced by dilution in HEK100 buffer (pH 7.7). From left to right, the curves show disassembly induced by dilution 20 s, 1 min, 3 min, and 5 min after assembly had been initiated.

