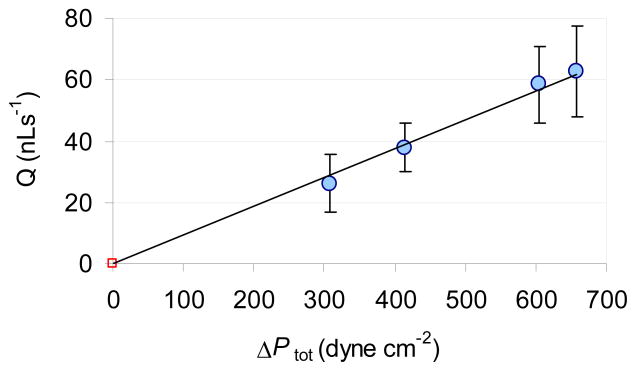
Figure 4.
Correlation between the total pressure difference and the induced flow rate. The data points (flow rates in the first 5 s of flow) are plotted with the best fit line Q = m·ΔPtot The symbols represent the mean values of n=3 parallel measurements performed in the same device. They are plotted with their standard deviation. The ΔPtot values are from Table 1.

