
Figure 5.
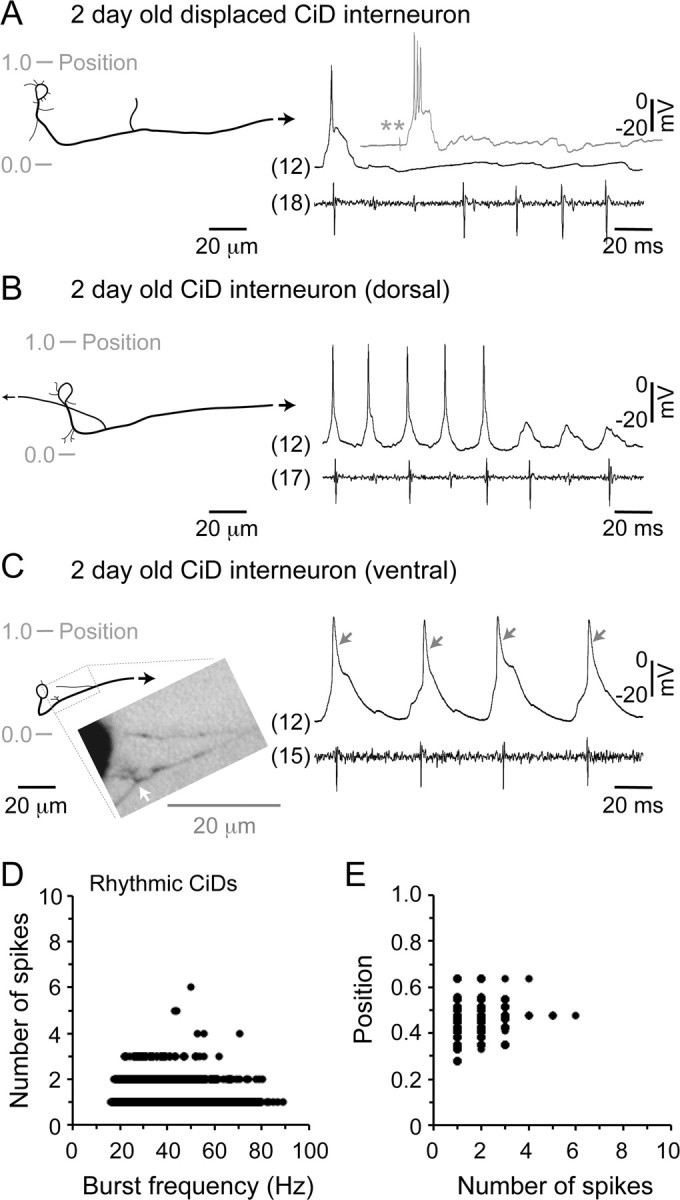
Excitatory interneuron firing during fictive swimming. A, Recording from a dorsally displaced CiD interneuron in an embryo, with the reconstructed cells on the left and the corresponding physiology immediately to the right. Gray-shaded lines indicate the position with respect to the dorsal (1.0) and ventral (0.0) edges of spinal cord. The arrow indicates continuation of the axon out of the field of view. The respective segment from which the cell and the nerve recording were obtained is indicated in parentheses. The gray-shaded trace inset is from the same CiD cell and illustrates only the patch recording in response to a suprathreshold stimulus (double asterisk). While the stronger stimulus could not elicit firing in consecutive cycles, it did, however, cause more spikes. B, Recording from a dorsally located CiD interneuron is organized as detailed for A. Note the prominent ascending axon. C, Recording from a ventrally located CiD interneuron is organized as detailed for A. A photograph detailing the boxed region of the cell is inset, and a white arrow points out the growth of what is most likely new axon. Gray arrows point out the relatively broad action potentials of this cell. D, Plot of the number of spikes per cycle generated by excitatory interneurons versus swimming frequency. Data represent 12,641 cycles from 20 CiD cells (black circles). E, Plot of the somatic dorsoventral position of excitatory interneurons versus the number of spikes. Graph is plotted from the same dataset in D.