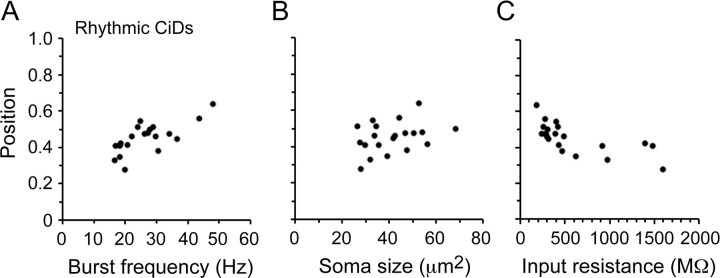
Figure 6.
Excitatory interneuron recruitment, size, and excitability in embryos. A, Plot of spinal cord position versus swimming frequency for 20 CiD somata (open black circles). Correlation values: r = 0.72, p < 0.001, n = 20. B, Plot of soma position versus soma size for the same CiDs in A. Correlation values: r = 0.34, p = 0.15, n = 20. C, Plot of soma position versus input resistance for the same CiDs in A and B. Correlation values: r = −0.68, p < 0.001, n = 20. Each data point in A–C represents the mean value for each cell.

