Figure 8.
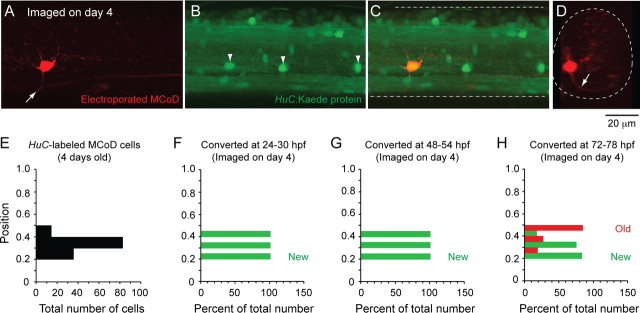
Kaede labeling to track MCoD differentiation in vivo. A–C, Confocal z stack (47 μm in depth) from midbody (segment 15) illustrates an MCoD electroporated with dye in a 4-d-old transgenic HuC:Kaede fish. A, The MCoD axon crosses spinal cord at the white arrow. B, White arrowheads mark laterally located cells, which are likely MCoDs. C, Merged image demonstrates one of the laterally located HuC:Kaede cells is indeed an MCoD and so is yellow. D, An optical cross section of the z stack in A illustrates that the MCoD is located ventrally and has a commissural process (at white arrow). E, A bar chart illustrating the dorsoventral distribution of all 131 HuC:Kaede-labeled MCoD cells from 32 4-d-old larvae. F–H, Bar charts illustrating the percentage of HuC:Kaede-labeled MCoD cells imaged on day 4 at different dorsoventral locations that contained any red Kaede protein (old, red bars) or only green Kaede protein (new, green bars) when converted at either 24–30 hpf (day 1, F), 48–54 hpf (day 2, G), or 72–78 hpf (day 3, H).

