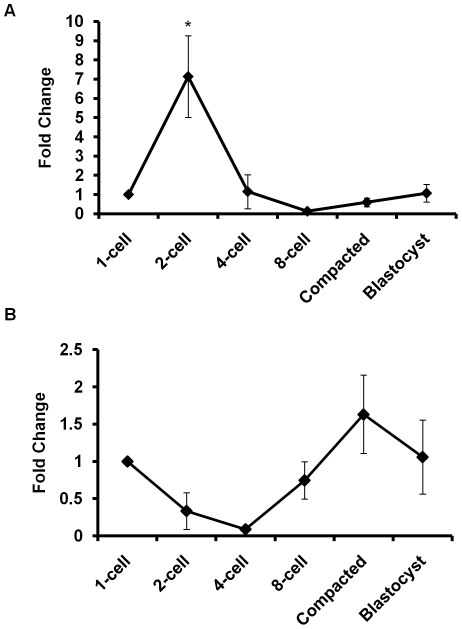
Figure 1. Characterization of Snai1 and Snai2 expression.
(A) Snai1 transcripts were detected using quantitative RT-PCR performed on pools of 20 fresh flushed embryos, at each stage of development (1-cell, 2-cell, 4-cell, 8-cell, compacted embryo and blastocyst); n = 3, p<0.05±S.E.M. (B) Snai2 transcripts were detected using quantitative RT-PCR performed on pools of 20 fresh flushed embryos, at each stage of development (1-cell, 2-cell, 4-cell, 8-cell, compacted embryo and blastocyst); n = 3, p<0.05±S.E.M.

