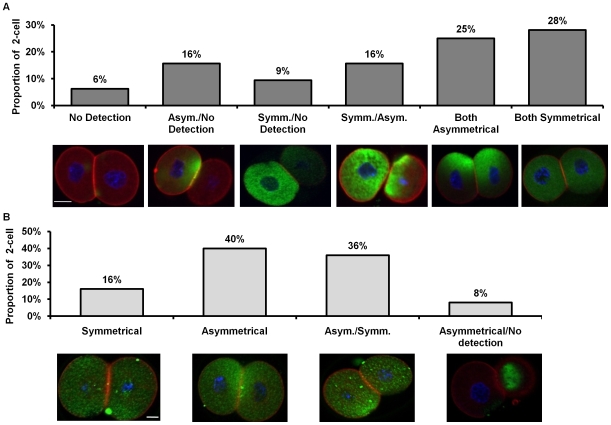
Figure 3. Representative images of SNAI1 and SNAI2 localization at the 2-cell stage.
(A) Embryos were categorized based on SNAI1 localization; n = 32, three replicates. (B) Embryos were categorized based on SNAI2 localization; n = 25, three replicates. Red = Filamentous Actin; Blue = Nuclei; Green = SNAI1 (A) or SNAI2 (B). Scale bars = 10 µM.

