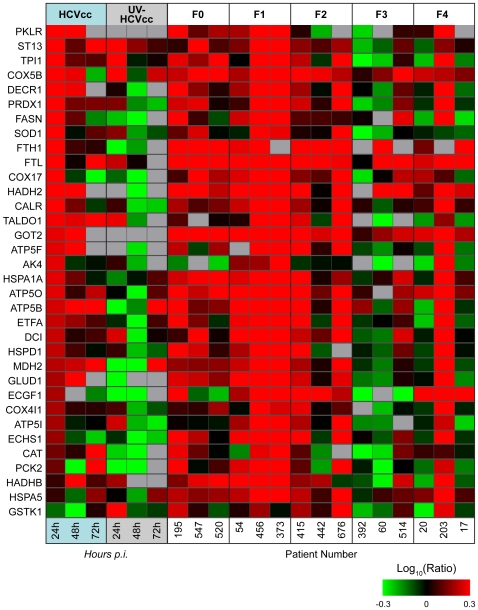
Figure 4. Common regulation of protein abundance changes in HCV-infected Huh-7.5 cells and patient liver tissue.
Each horizontal row represents a differentially regulated protein identified by its gene symbol. Each vertical column represents an individual sample. Abundance ratios for the various samples appear in the following order from left to right: cultured hepatoma cells infected with HCVcc at 24, 48 and 72 h, cultured hepatoma cells exposed to UV-HCVcc at 24, 48 and 72 h, and then patients chronically infected with HCV and exhibiting stage 0 (F0), stage 1 (F1), stage 2 (F2), stage 3 (F3) or stage 4 (F4) fibrosis [20]. Protein abundance ratios are colored according to the fold changes and the color scale indicates the magnitude of fold change. Black squares indicate no change in protein abundance. Gray squares indicate missing data. Protein abundance information for HCVcc-infected Huh-7.5 cells can be found in Supplementary Table S2 and for human liver biopsy specimens in [20].

