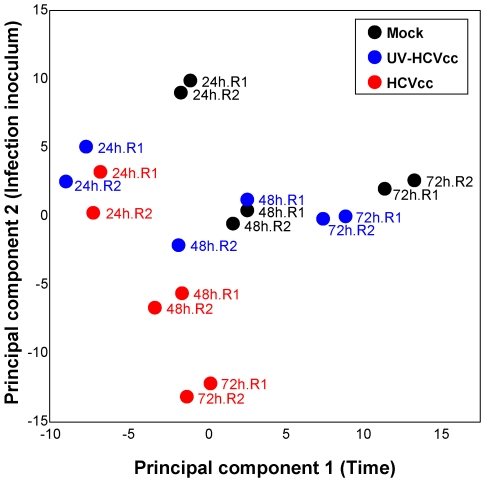
Figure 5. Principal components analysis scores plot showing the segregation of samples based on lipid profiles.
Duplicate lipid abundance measurements (corresponding to R1 and R2) were made 24, 48 and 72 h after infection with either HCVcc or UV-HCVcc and using a time-matched mock (conditioned media, CM) as the reference. A total of 272 features significantly different (ANOVA, p<0.05) between treatment and time were compared using principal components analysis (PCA). The scores plot shows temporal differences (represented along principal component 1) as well as HCV-specific differences (represented along principal component 2).

