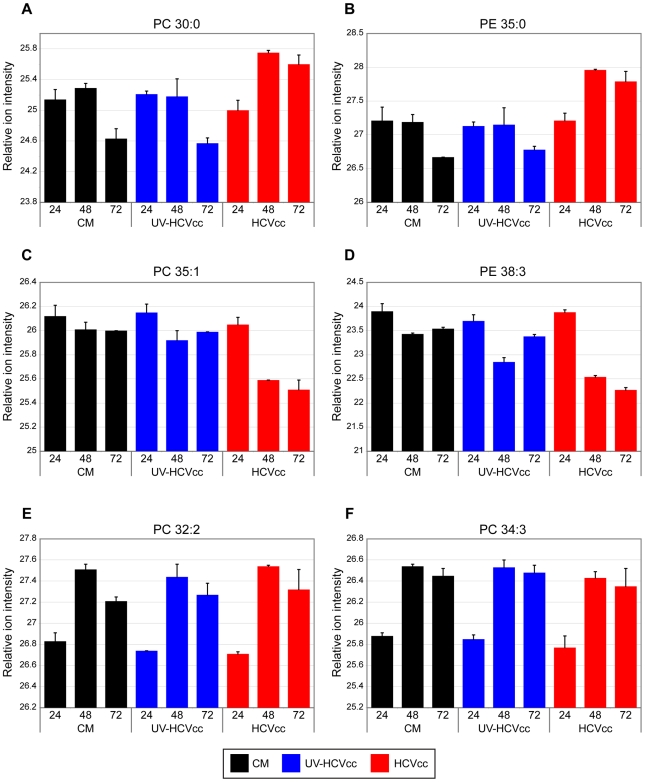
Figure 6. Representative examples of phospholipid species differentially regulated during HCV infection.
The relative ion intensity, log 2 scale, and standard deviation is plotted for various phosphatidylcholine (PC) and phosphatidylethanolamine (PE) species monitored 24, 48 and 72 h after infection with either HCVcc (red bars) or UV-HCVcc (blue bars) and using a time-matched mock (conditioned media, CM; black bars) as the reference. Panels A-D (lipid species PC 30∶0, PE 35∶0, PC 35∶1, and PE 38∶3, respectively) provide examples of phospholipid species exhibiting notable changes in abundance during the course of HCV infection. Temporal lipid abundance changes conserved across treatment conditions, panels E and F (lipid species PC 32∶2 and PC 34∶3, respectively), demonstrate the specificity of those perturbations attributed to HCV infection. See Supplementary Table S3 for a complete listing of the lipid features detected in this study.

