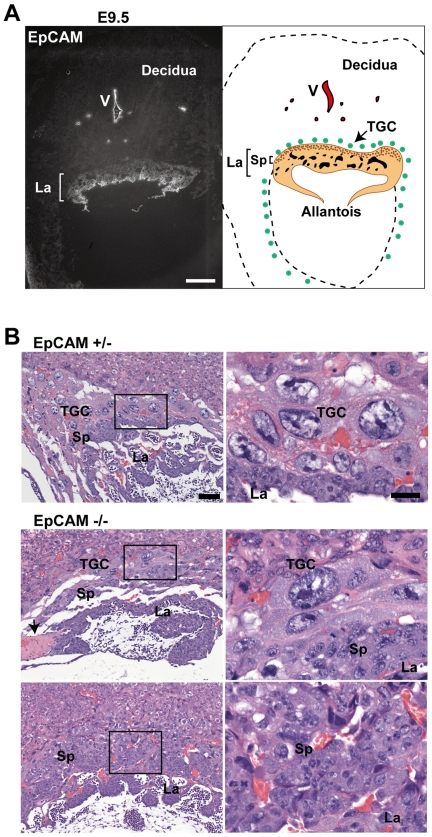
Figure 4. Defective placental development in the absence of EpCAM.
(A) EpCAM expression in wild type C57BL/6 placentas at E 9.5 as shown by immunofluorescence staining (left). Bar = 200 µm. Right panel shows a schematic of E9.5 placenta. La = labyrinth, Sp = spongiotrophoblasts, TGC = parietal trophoblast giant cells, V = vasculature. (B) Morphology in H&E stained sections of EpCAM +/− and −/− placentas. Bars = 50 and 20 µm. Panels on the right represent high power view of insets in the left panels. Arrow in B highlights intravascular microthrombus.

