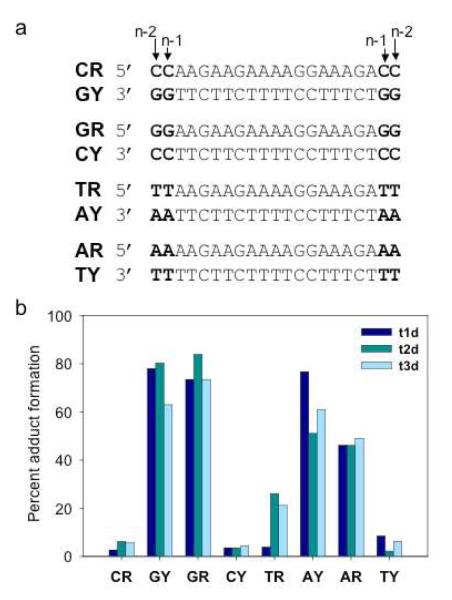
Figure 3. Adduct formation between platinated TFOs and DNA duplexes.
(a) Sequences of the DNA duplexes. Bases shown in bold lie outside the TFO binding site. (b) Percent adduct formation between platinated TFOs t1d (dark blue), t2d (medium blue), or t3d (light blue) and the purine or pyrimidine strands of each of the DNA duplexes. Solutions containing 1 μM 32P-labeled duplex and 2 μM platinated TFO were incubated in triplex buffer at 37°C for 48 hrs and then analyzed by PAGE on a 20% denaturing gel. The amount of adduct formed was quantitated by phosphorimaging the gel.

