
Figure 1. NK cells are the first and predominant IL-10 expressing population in acute toxoplasmosis.
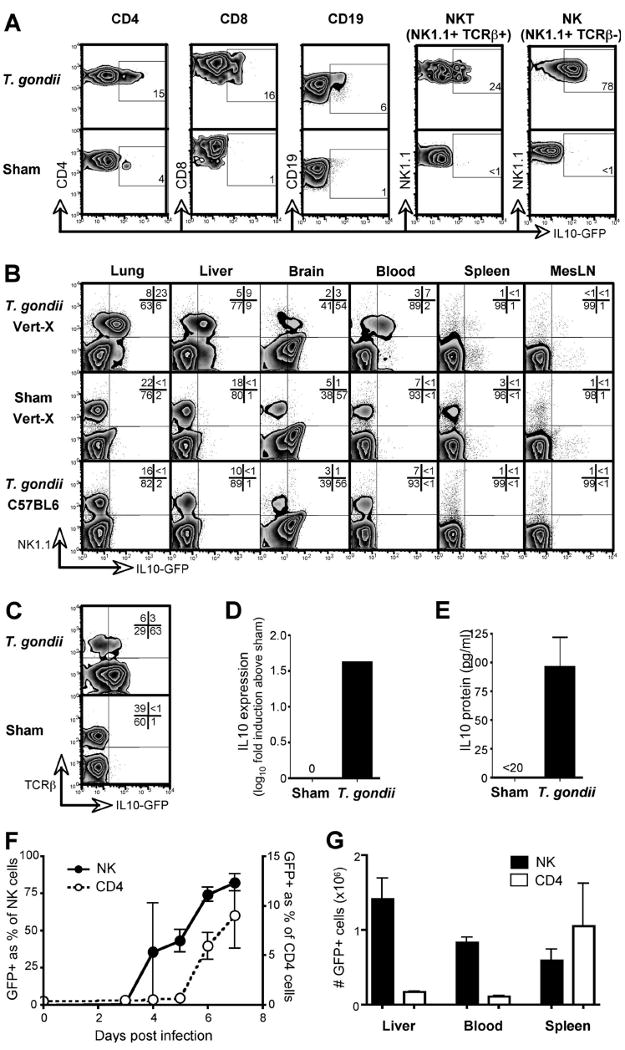
Vert-X IL-10 reporter mice were infected with T. gondii and, 7 days later, the indicated lymphocyte populations analyzed by flow cytometry. Sham-infected Vert-X mice were analyzed for comparison. (A) Liver cells were stained to distinguish lymphocyte subsets. Numbers indicate the percentage of GFP positive cells within each population, rounded to the nearest full digit. (B) Lymphocytes from various tissues were assessed for NK1.1 and IL-10. Infected non-reporter mice were included to control for autofluorescence. (C) NK1.1-gated cells were stained with TCRβ to discriminate NK and NK T cells. (D) NK cells (NK1.1+TCRβ-) were sorted from the livers of T. gondii-infected non-reporter mice. IL-10 expression was determined by RT-PCR and is shown as fold induction over sham-infected controls. (E) Cells were isolated as in (D) and IL-10 protein production was measured after stimulation with PMA and ionomycin. Error bars indicate SD of triplicate cultures. (F) Vert-X mice were bled at various times post-infection and GFP expression within the indicated populations was quantified by flow cytometry. Data depict the mean of three mice ± SD. (G) Vert-X mice were infected with T. gondii and, on day 7, the total numbers of GFP+ NK1.1+ TCRβ- (NK) and GFP+ CD4+ (CD4) cells calculated per organ or per ml of blood. Data depict the mean of three mice ± SD. All panels are representative of two or more independent experiments.