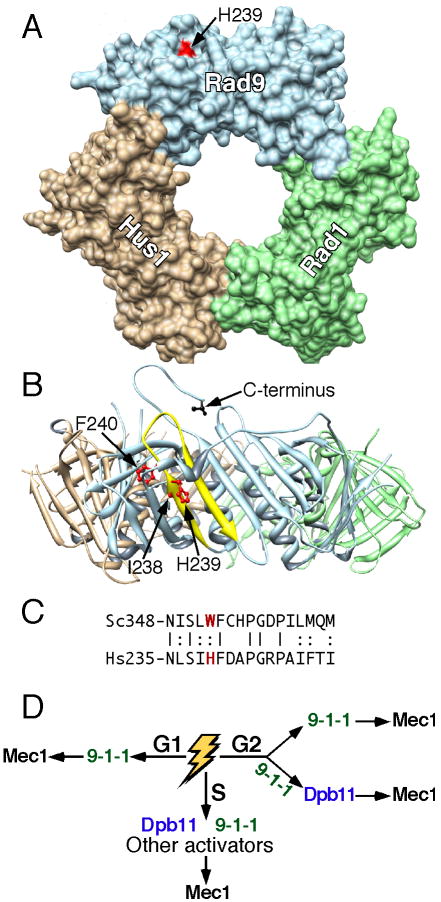
Figure 6. Role of 9-1-1 in two distinct checkpoint pathways.
(A) Surface representation of the 9-1-1 crystal structure (Dore et al., 2009). Head-on view with I238, H239, and F240 in red. Note that only H239 is surface-exposed. The Rad9 C-terminus is in back of the donut. The Chimera molecular viewer was used (Pettersen et al., 2004).
(B) Ribbon representation after a 90° x-axis rotation. The Rad9 (aa235-252) β-strand-loop-β-strand is in yellow with I238, H239, and F240 as stick models in red. The C-terminal aa273 of truncated Rad9 is shown in black.
(C) Alignment of the β-strand-loop-β-strand of human Rad9 with yeast Ddc1.
(D) Model for the participation of 9-1-1 in two pathways depending on the phase of the cell cycle.

