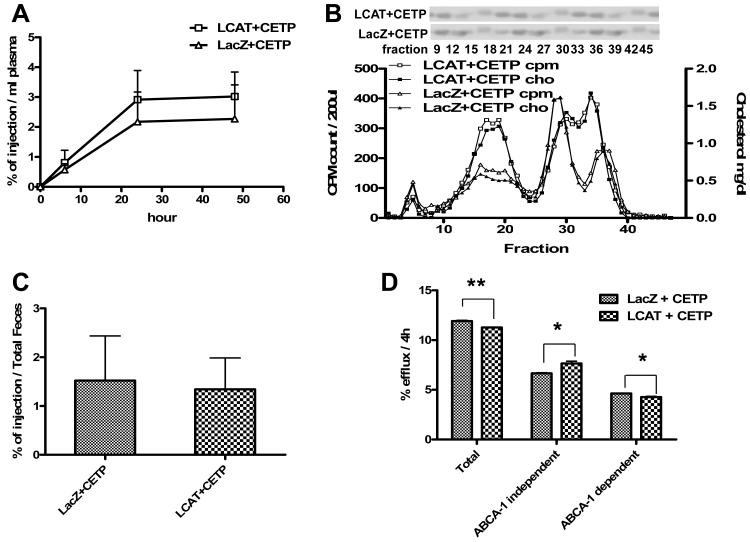
Figure 6.
Efflux and macrophage RCT in hApoA-1 tg mice injected 1×10¹⁰GC hLCAT AAV8 +1×10¹¹GC hCETP AAV8 (n=8) or LacZ +1×10¹¹GC hCETP AAV8 as a control (n=6). A, the change of 3H-labeled cholesterol in plasma. B, 3H-labeled cholesterol lipoprotein profile Cholesterol mass profile and Western blot of hApoA-1 using each fraction of pooled plasma samples drawn 48 hours after injection of J774 cells. C, 3H-labeled cholesterol in feces of each group. D, Total (with cAMP), ABCA1-independent (without cAMP), and ABCA1-dependent efflux in J774 macrophage. Data shown are mean ± SD.*P<0.05, **P<0.01.

