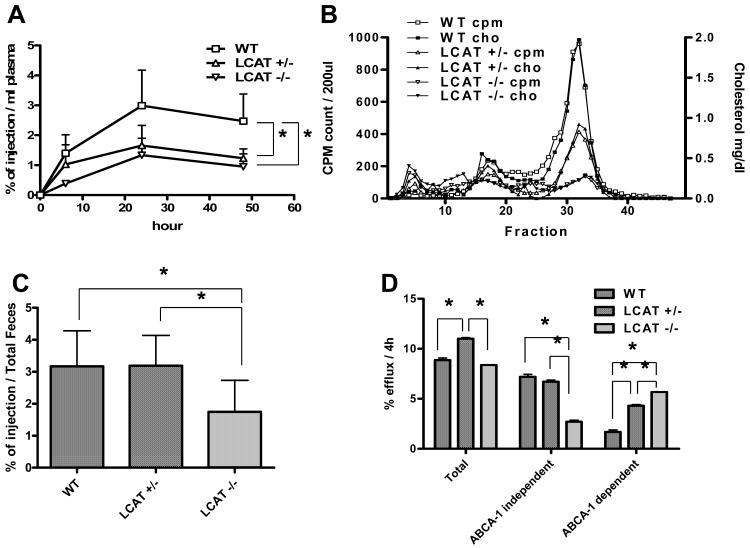
Figure 7.
Efflux and macrophage RCT in LCAT-/- KO mice (n=8), LCAT+/- KO mice (n=8) or WT mice (n=8). A, the change of 3H-labeled cholesterol in plasma. B, 3H-labeled cholesterol lipoprotein profile and Cholesterol mass profile of pooled plasma samples drawn 48 hours after injection of J774 cells. C, 3H-labeled cholesterol in feces of each group. D, Total (with cAMP), ABCA1-independent (without cAMP), and ABCA1-dependent efflux in J774 macrophage. Data shown are mean ± SD.*P<0.05.

