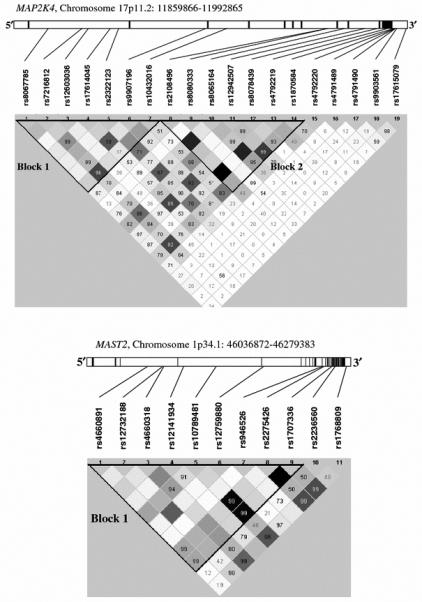
Fig. 1.

Haplotype blocks for the MAP2K4 and MAST2 genes. Haplotypes blocks were defined using the Gabriel model in Haploview. Each haplotype block is shown as a triangle. Shaded regions indicate strength of linkage disequilibrium (LD) between pairwise combinations of polymorphism (white: r2=low LD, black: r2=near perfect LD). Numbers in squares indicate estimate of pairwise D-prime, expressed in percentages. Pairs with unreported values have D-prime values of 1.0 (100%). MAP2K4 has 2 successive haplotype blocks from 5′ to 3′. Physical locations of each SNP, exons (dark bars) and introns are also shown for the gene. Exon 1 starts from the left side for both MAP2K4 and MAST2
