Figure 3.
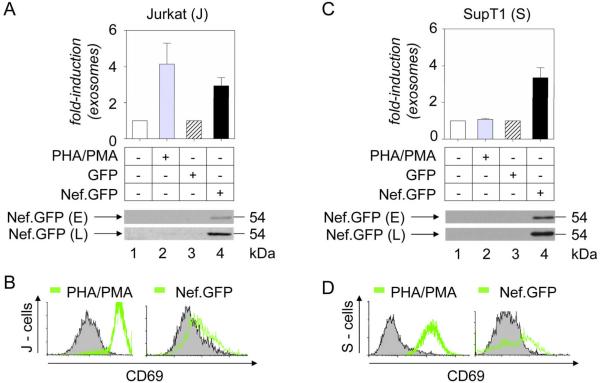
Nef increases the production of exosomes in transformed T cells. (A and C) Production of exosomes. Measured were amounts of exosomes released from control Jurkat (A) or SupT1 (C) cells (lane 1, white bar), those activated with PHA/PMA (lane 2, grey bar), and those expressing GFP (lane 3, white bar with black stripes) or Nef.GFP (lane 4, black bar). Experiments were conducted and data are presented as in Fig. 1. Results are presented as the mean ±SD of three independent experiments. 10 μg of these exosomal preparations were also analyzed for the presence of Nef with anti-GFP antibodies by western blotting. Capital letters E and L stand for exosome and cell lysate, respectively. (B and D) Activation of manipulated transformed T cells. Activation states of PHA/PMA-treated and Nef-expressing Jurkat (B) or SupT1 (D) cells were analyzed with antibodies to CD69 by FACS. Representative FACS profiles from resting, untransfected (black curve, gray surface) and PHA/PMA-treated or Nef.GFP-expressing (green curve) cells are presented.

