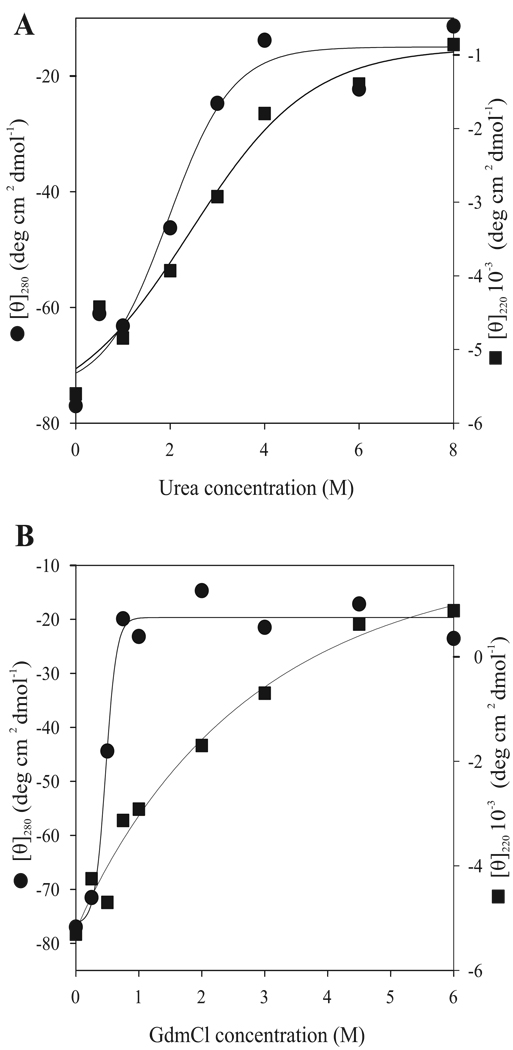
Fig 3.
Urea- and GdmHCl-induced unfolding of PVA VPg monitored by CD spectroscopy. Three spectra were added and averaged. The data are given as mean molar ellipticity at 280 nm (●; scale on the left) and at 220 nm (■; scale on the right) in the increasing urea (A), and GdmHCl (B) concentrations. Tertiary structure disrupted in lower denaturant concentrations than the secondary structure. In the presence of GdmHCl unfolding of the tertiary structure occurred already in 0.5M concentration.

