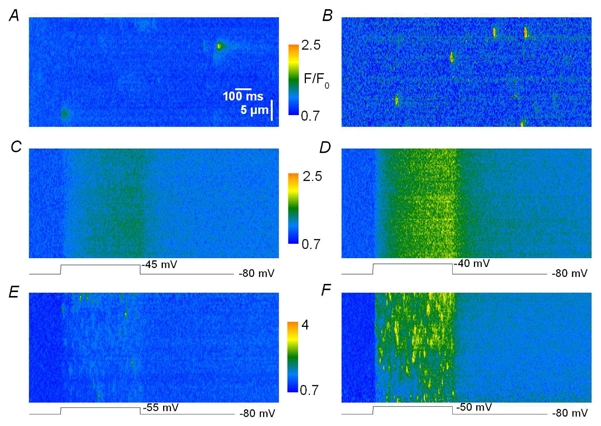
Figure 1. Spontaneous and voltage activated Ca2 release events in skinned and intact skeletal muscle fibers, respectively.

A, B, strips of fluo-3 fluorescence line-scan images taken from a chemically skinned skeletal muscle fiber isolated from a mouse and from a frog, respectively. The frog image was from measurements performed in the Department of Physiology at University of Debrecen under the conditions described in Szentesi et al. (2004). C, D, strips of line-scan images from a voltage-clamped intact mouse skeletal muscle fiber depolarized by a 500 ms long pulse to −45 and −40 mV, respectively. E, F strips of line-scan images from a voltage-clamped intact frog skeletal muscle fiber depolarized by a 500 ms long pulse to −55 and −50 mV, respectively.
