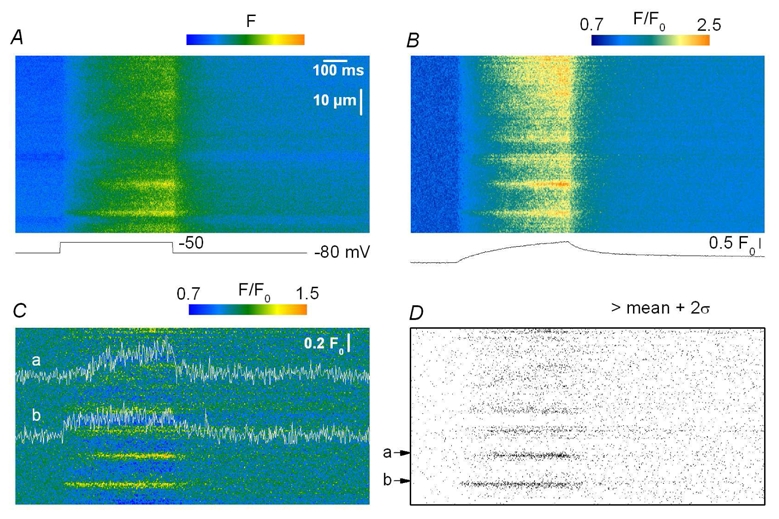
Figure 2. Identification of voltage-activated calcium release events.

A, raw fluo-3 fluorescence line-scan image from a mouse skeletal muscle fiber. B, corresponding image after correction for baseline fluorescence (F/F0). F0(x) was obtained by averaging the fluorescence in the time domain during the baseline period (200 ms). The trace below the image shows the corresponding spatially averaged global F/F0 signal. C, corresponding F/F0 image after high-pass FFT filtering (see Methods). D, Ca2+ release events identified by the detection routine; the time course of the corresponding events is shown superimposed on the image in Fig. 2 C; it was obtained by averaging three neighboring lines in the space domain positioned at the center of the events.
