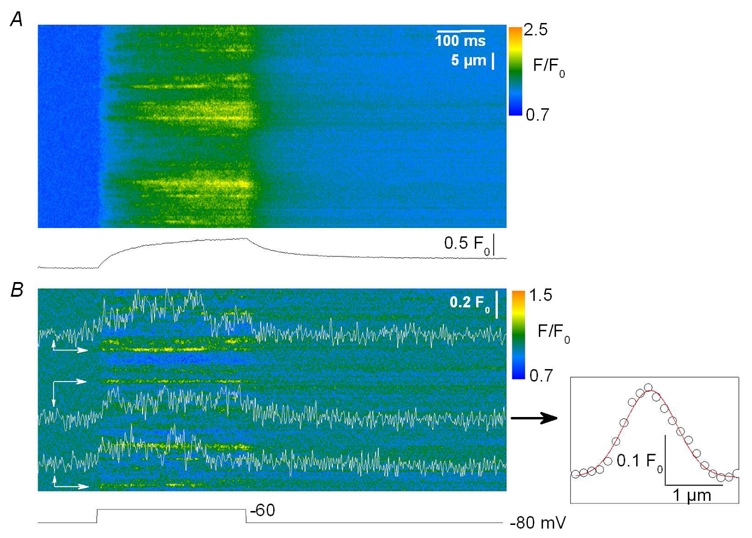
Figure 3. Time course and spatial spread of voltage-evoked Ca2+ release events.

A, baseline corrected fluo-3 fluorescence line-scan image from a mouse skeletal muscle fiber depolarized by a 500 ms long depolarization to −60 mV. The bottom trace shows the corresponding spatially averaged global F/F0 signal. B, corresponding F/F0 image after high- pass FFT filtering. Identified Ca2+ release events (as described in Fig. 2) were further analyzed by averaging three neighboring lines in the space domain, positioned at the center of the events (marked by arrows) to obtain their time course. The inset on the right shows the spatial spread of the event on the left in the line-scan image; the superimposed line corresponds to the result from fitting a Gaussian function to estimate FWHM.
