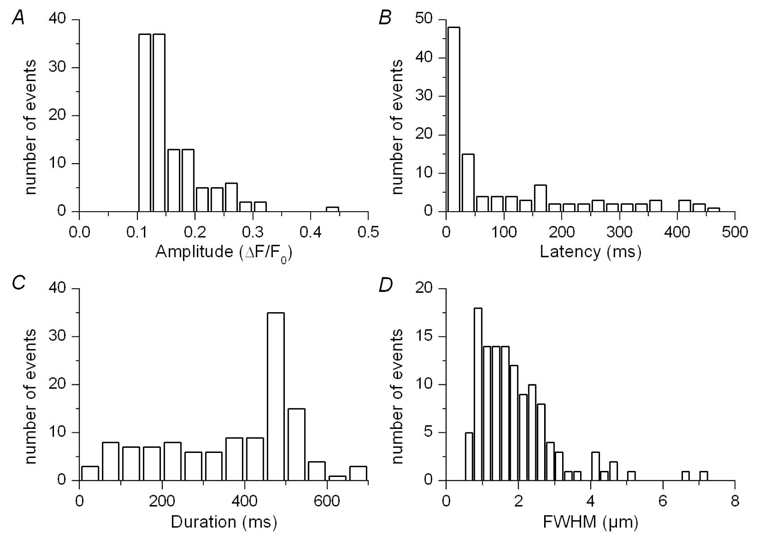
Figure 5. Properties of voltage-evoked Ca2+ release events in mouse skeletal muscle fibers.

Event amplitude (A), latency (B), duration (C) and FWHM (D) are presented as distribution histograms.

Event amplitude (A), latency (B), duration (C) and FWHM (D) are presented as distribution histograms.