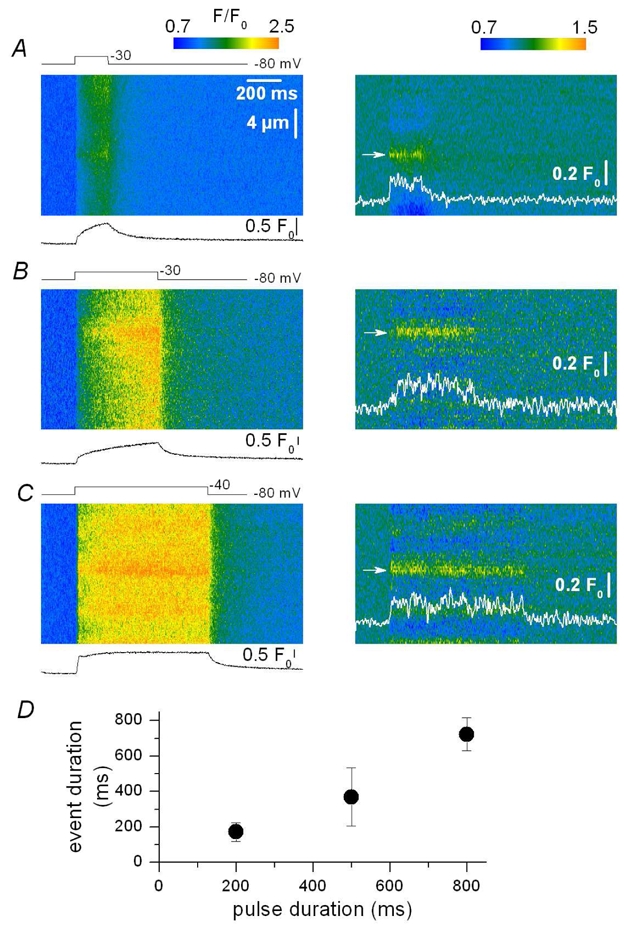
Figure 6. Ca2+ release events for various durations of membrane depolarization.

A–C, baseline corrected (F/F0) line-scan images of fluo-3 fluorescence (left) and corresponding filtered images (right, see Methods) from three distinct mouse skeletal muscle fibers depolarized by voltage-clamp pulses, In A, B and C the fiber was depolarized by a 200-, 500- and 800 ms-long pulse from −80 mV to −30, −30 and −40 mV, respectively; the trace below each image corresponds to the spatially averaged global F/F0 signal. In the right panels the traces show the time course of an identified Ca2+ release event (arrow) within each corresponding image. D, dependence of the mean event duration upon the length of the pulse; data are from 13, 121 and 15 events for pulses of 200, 500 and 800 ms duration, respectively. Error bars correspond to the standard deviation.
