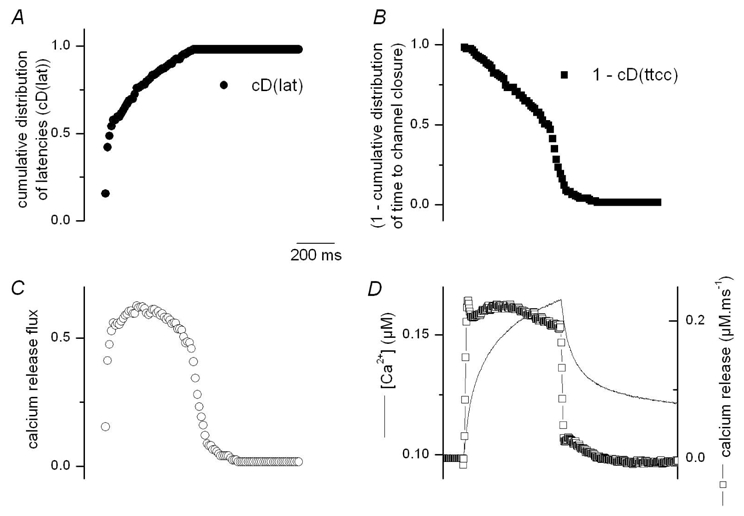
Figure 7. Reconstruction of the SR Ca2+ release flux.

A, B, cumulative distribution of latencies (cD(lat)) and of time to channel closure (cD(ttcc)) from Ca2+ release events elicited by 500 ms long depolarizations. C, time course of SR permeability calculated as cD(lat).(1-cD(ttcc)). D, Ca2+ release flux (open squares) estimated from the global calcium transient obtained from averaging the F/F0 images in the spatial domain (thin line). Global Ca2+ release was calculated using a removal model (see Szentesi et al., 2004).
