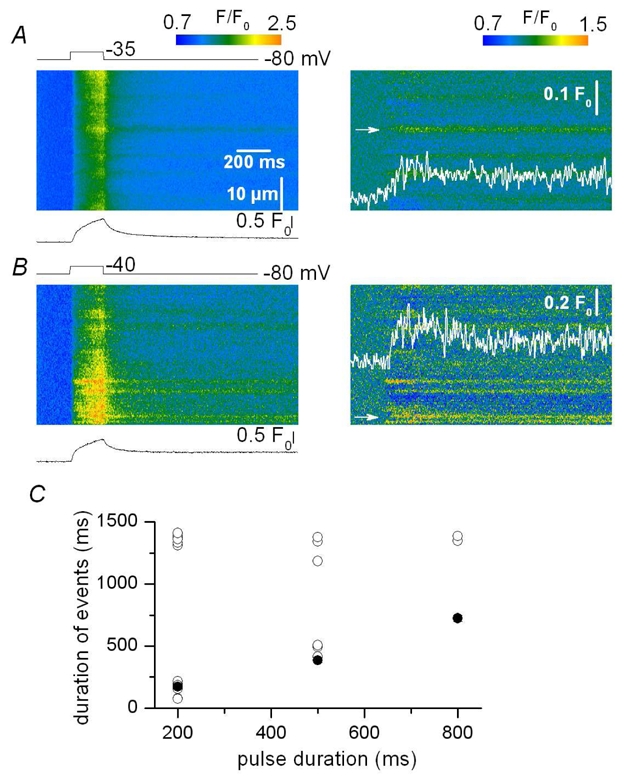
Figure 8. Voltage-activated Ca2+ release events in the presence of Maurocalcine.

A–B, baseline corrected (F/F0) line-scan images of fluo-3 fluorescence (left) and corresponding filtered images (right, see Methods) from two distinct mouse skeletal muscle fibers depolarized by 200 ms long voltage-clamp pulses to −35 mV and −40 mV, respectively. The two fibers were injected with a solution containing 0.5 mM maurocalcine (see Methods). C, dependence of the values for the duration of the events in maurocalcine-injected fibers (open circles) versus the length of the pulse; filled circles correspond to the mean values in control fibers (see text for details).
