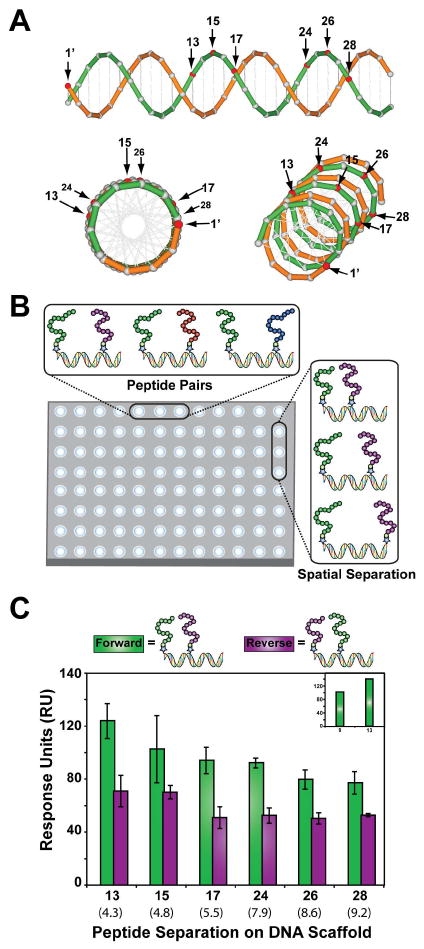
Figure 4.

Combinatorial examination of ligands and linkers. (A) A model of the DNA backbone showing the spatial separation between individual peptide positions. Modified nucleotide positions (red) indicate the locations where peptides were conjugated to the DNA. (B) Combinatorial analysis of bivalent DNA-peptide fusion molecules was performed in a single step using a Biacore Flexchip that measured 400 independent binding interactions. (C) The combinatorial peptide pair and peptide pair distance assay was used to screen BP1 and AD1 in two orientations at six different base pair distances on the DNA scaffold. (inset) binding response of the forward synbodies at nucleotide positions 9 and 13. The synbody with the highest relative response to Gal80 was determined to be the combination with BP1 and AD1 at positions 1′ and 13, respectively. Approximate linear distances in nanometers are given in parenthesis.
