
Figure 6.
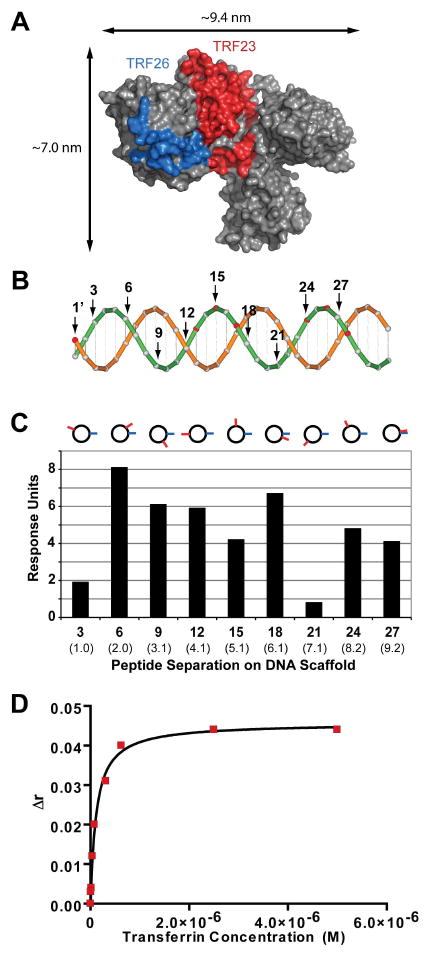
Generation of a transferrin synbody. (A) The transferrin peptides, TRF23 and TRF26, were mapped using PyMOL to the X-ray crystal of transferrin (PDB ID: 2HAV) by protein crosslinking experiments shown in red and blue, respectively. (B) A cartoon of the dsDNA scaffold used to spatially separate TRF23 and TRF26 peptides. TRF23 was conjugated to the 1′ base pair position on the template strand (orange) and TRF26 was conjugated to one of every third base pair position on the complementary strand (green). (C) The peptide distance assay was used to screen TRF23 and TRF26 at nine different base pair positions on the DNA scaffold. The synbody with the highest relative response to transferrin occurred when TRF26 was at the 1′ position and TRF23 was at the 6 base pair position termed TRF SC-6. Approximate linear distances in nanometers are given in parenthesis and the cartoon above the graph indicates the peptide positions when looking down the dsDNA helix. (D) The average of three fluorescence anisotropy experiments of TRF SC-6 resulted in a Kd of 86.5 ± 18.6 nM.