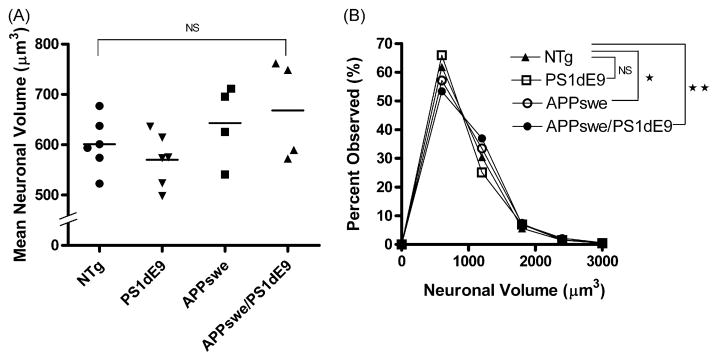
Fig. 2.
Mean neuronal volumes (μm3) of APPswe (n = 4), PS1dE9 (n = 6), APPswe/PS1dE9 (n = 4), and ntg (n = 6) littermates with C57BL/6J background which were processed as paraffin sections. The data suggest a trend towards larger mean cortical neuronal volumes in the APP overexpressing tg mice (APPswe and APPswe/PS1dE9) compared to their ntg as well as PS1dE9 littermates, however it was not statistically significant (p > 0.05) (A). Statistical analysis (Kolmogorov–Smirnov Test) demonstrated highly significant differences in the distributions of the cortical neuronal sizes of APPswe (*p < 0.01) and APPswe/PS1dE9 (**p < 0.001) compared to their ntg littermates. There was no statistically significant difference between ntg littermates and PS1dE9 tg mice (B).

