
Figure 4.
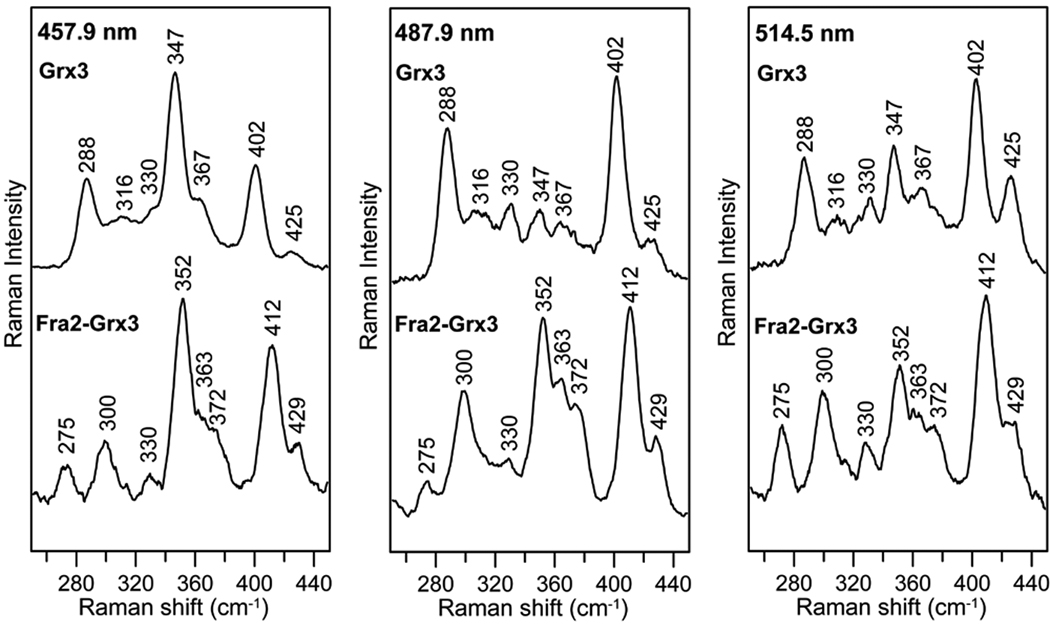
Comparison of the resonance Raman spectra of [2Fe-2S] Grx3 and [2Fe-2S] Fra2-Grx3 with 457.9-, 487.9-, and 514.5-nm laser excitation. Samples were ~ 2 mM in [2Fe-2S] cluster and were in the form of a frozen droplet at 17 K. Each spectrum is the sum of 100 scans, with each scan involving photon counting for 1 s at 0.5 cm−1 increments with 6 cm−1 spectral resolution. Bands due to lattice modes of ice have been subtracted from both spectra.