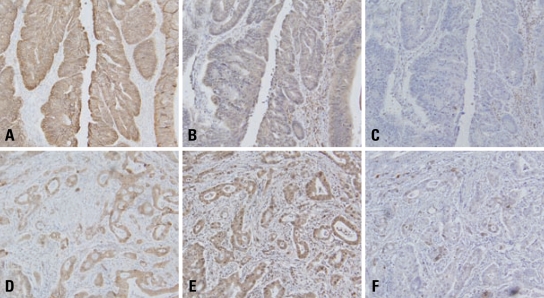
Fig. 7.
Topographic distributions of E-cadherin (A, D), Snail (B, E), and COX-2 (C, F) in colon cancers by immunohistochemistry. (A, B and C) Expressions of COX-2 and Snail were decreased in the areas with positive expression of E-cadherin. (D, E, F) In contrast, expressions of COX-2 and Snail increased in the areas with abnormal E-cadherin expression (D). COX-2, cyclooxygenase-2.

