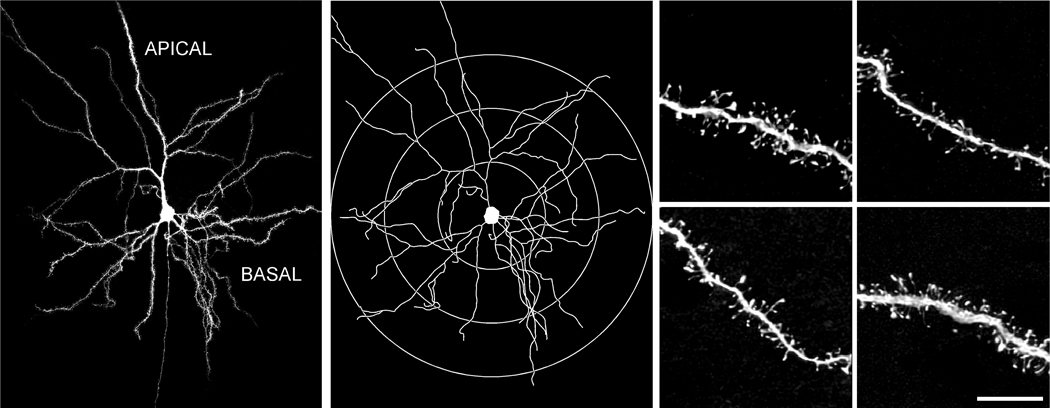
Figure 1. Methodology for comprehensive spine morphologic analysis of pyramidal neurons in layers II/III of dorsal mPFC.
Left: Digital reconstruction of a Lucifer Yellow-filled neuron in the rat dorsal mPFC at 160x magnification on a Zeiss 410 laser-scanning microscope from 5 separate confocal digital stacks (z-step = 0.5 µm), that were deconvolved and aligned in the x-y-z planes using Vias software (Rodriguez et al., 2003; Radley et al., 2006b). Middle: 2-dimensional map for the same neuron reconstructed with Neurolucida (MBF Biosciences). The different colored branches indicate increasing branch orders within single dendritic arbors. Radial distances are shown to depict the different zones within which segments were selected for dendritic reconstructions (< 75 µm, 75–150 µm, > 150 µm) at high magnification. Right: Examples of dendritic segments, imaged at 5,000X magnification (z-step = 0.1 µm). Scale bar = 150 µm (left); 10 µm (right).

