Figure 5.
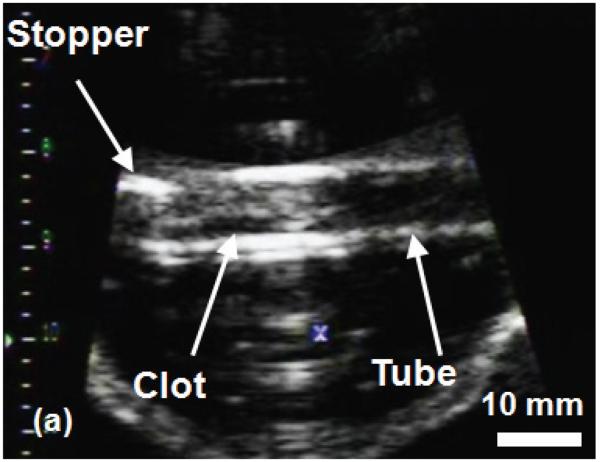
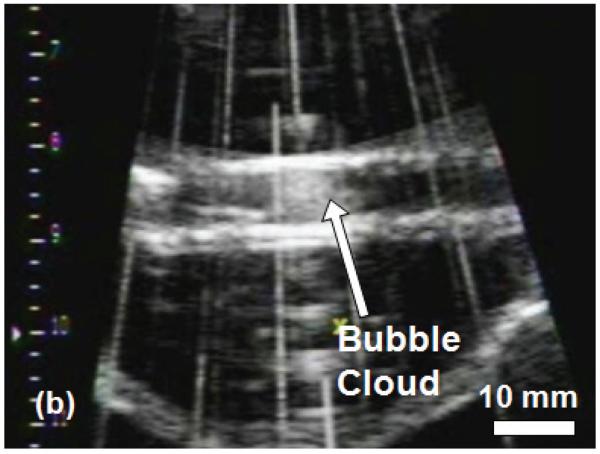
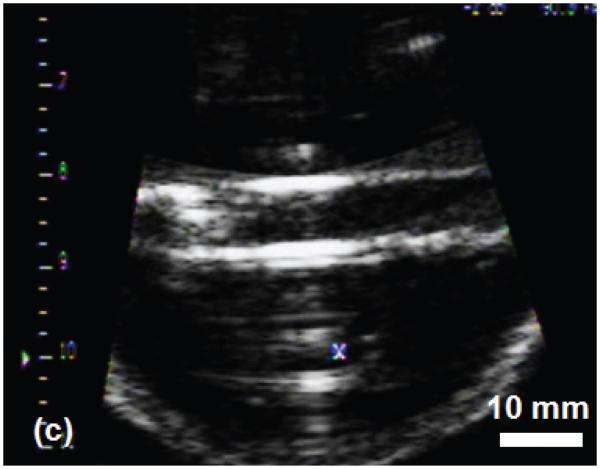
B-Mode images of the histotripsy thrombolysis treatment using a 5 MHz imaging probe. The imaging probe is approximately 8 cm from the ultrasound focus. The ultrasound propagation is from top to bottom of the image. The clot is visible in the tube as an echogenic region prior to insonation (a). The bubble cloud is visible during treatment in (b). The vertical lines in (b) are acoustic interference of the therapy transducer with the imager. However, most of the image remains uncorrupted. The echogenicity of the clot is greatly reduced after complete thrombolysis (c).


