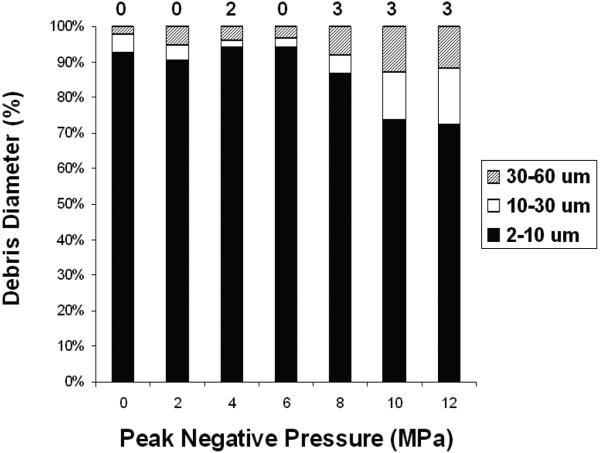
Figure 6.
Debris volume distribution by particle diameter as measured by the Coulter Counter. A majority of the debris volume is smaller than 10 μm diameter for samples at all pressure levels. However, an increase in larger particles (30-60 μm) is apparent at 10 and 12 MPa. The number of measurements where the 100 μm tube was blocked (number of particles > 60 um) is listed above each bar in the figure. There were 16 measurements taken at each pressure level.

