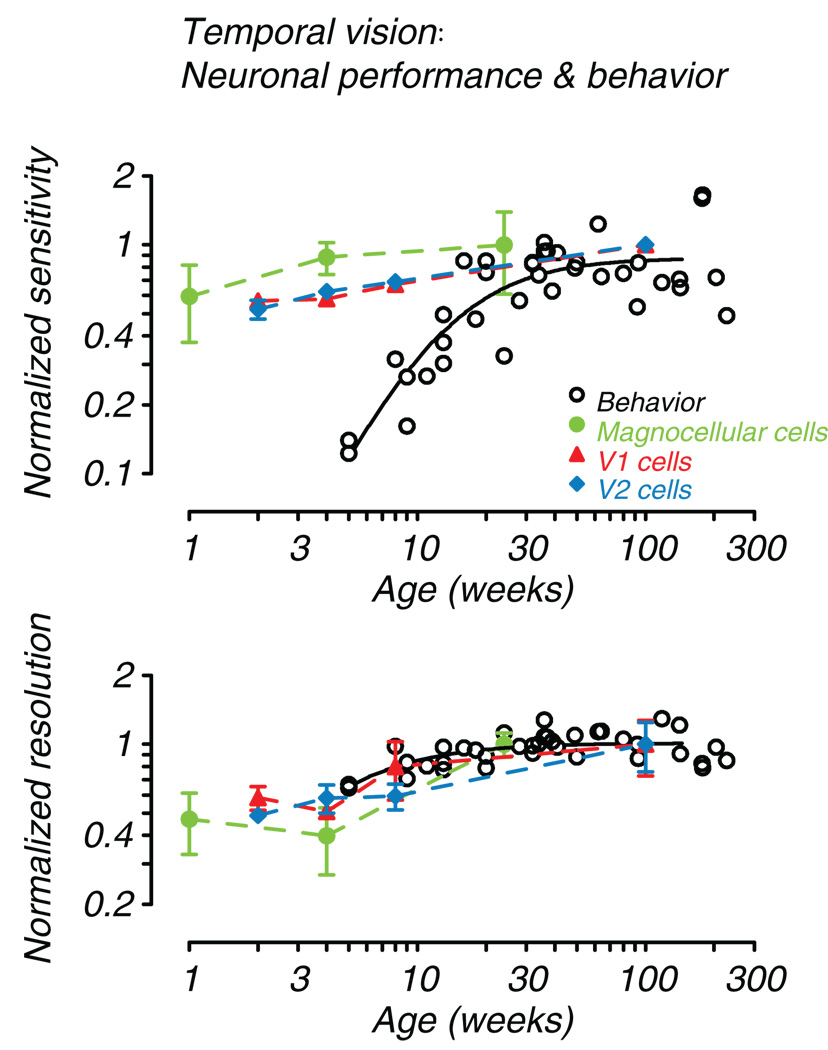
Fig. 6.
Comparison of behavioral and neural development. Normalized sensitivity and resolution are plotted as a function of age. Open circles and smooth curves are from Fig. 5 (A and C). The behavioral data are normalized to average adult levels (age > 100 weeks). Also plotted are normalized (to the oldest available age) mean sensitivity and characteristic frequency for magnocellular LGN neurons (green, filled circles; Movshon et al., 2005), and mean sensitivity and temporal resolution for V1 (red, filled triangles) and V2 (blue, filled diamonds) cells (Zheng et al., 2007, Table 1). Error bars are +/− 1SE.

