
Figure 4.
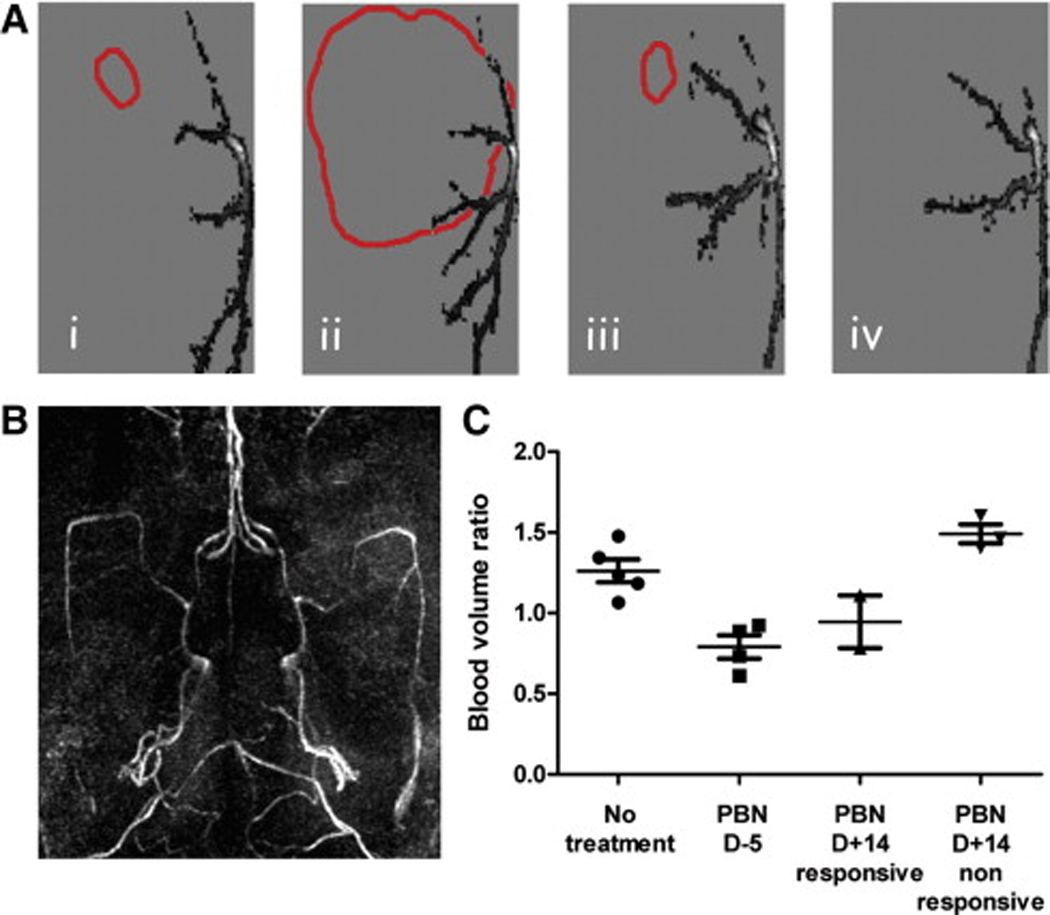
(A) 2D vasculature projections in the horizontal plane of a representative non-treated C6 glioma at day 8 (i) and 20 (ii) after cell implantation, and of a PBN pretreated C6 glioma at day 9 (iii) and 39 (iv). The tumor boundaries are also represented (red). (B) 3D maximum intensity projection (MIP) rendering of the brain vasculature. (C) Blood volume ratios for each treatment group at the last time point (days 17–21 for untreated rats and non-responsive rats (PBN D+14), and days 39–40 for treated rats (PBN D−5, PBN D+14 responsive), represented as means ± standard deviation.