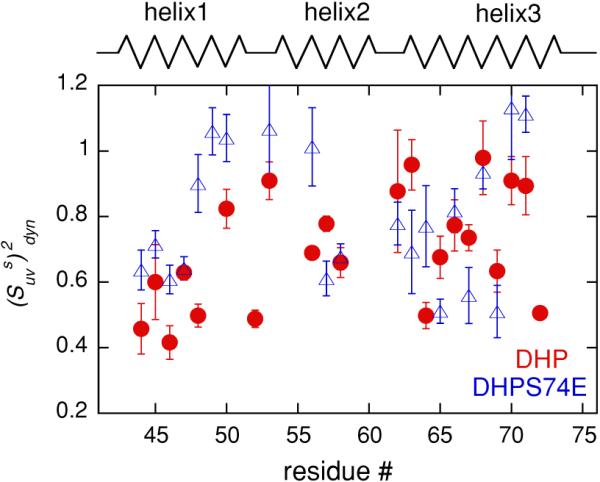
Fig. 4.

Dynamic cross-correlated order parameters for slow motions describing the amplitude of fluctuations of two N–HN dipole–dipole interactions involving successive residues. The data are shown for the C-terminal subdomains of DHP (red circles) and DHPS74E (blue triangles) as a function of residue number. Helices are represented by zigzag lines and unstructured regions by straight lines
