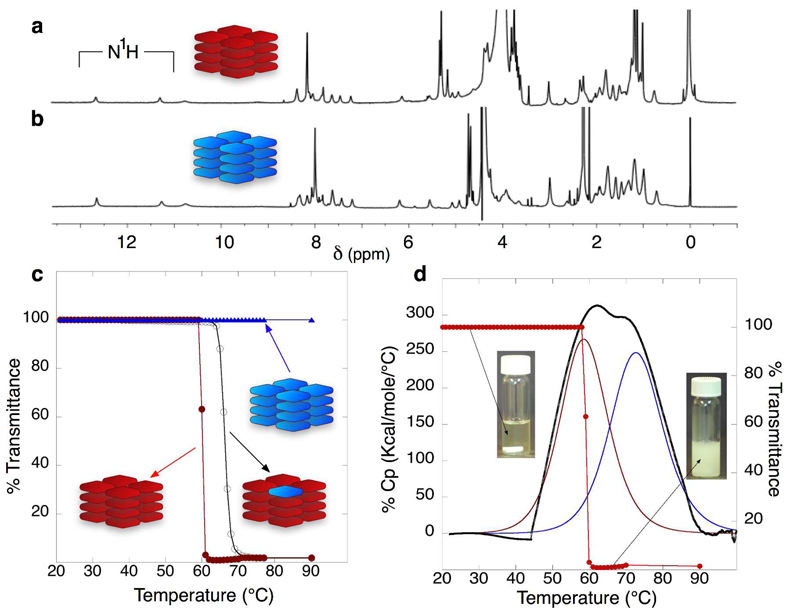
Figure 2.
1H NMR spectra (500 MHz, 10% D2O in H2O), DSC and turbidity data. (a) NMR spectrum of 216. (b) NMR spectrum of 116. The red and blue cartoons in a and b represent 216 and 116, respectively. (c) Turbidity curves (measured at 500 nm) for 216 (red circles), 116 (blue triangles), and the mixed 1•215 (hollow circles). The measurements were performed in aqueous phosphate-buffered solution (pH 7.1, 2 M KI). (d) DSC endotherm with the two resulting deconvolution peaks (dotted lines) representing the Tt, left, and the Tm, right. The overlaid turbidity curve (red circle) shows an excellent correlation with the DSC peak that corresponds to the Tt. Insets, vials with a solution of 216 below, left, and above, right, the Tt.

