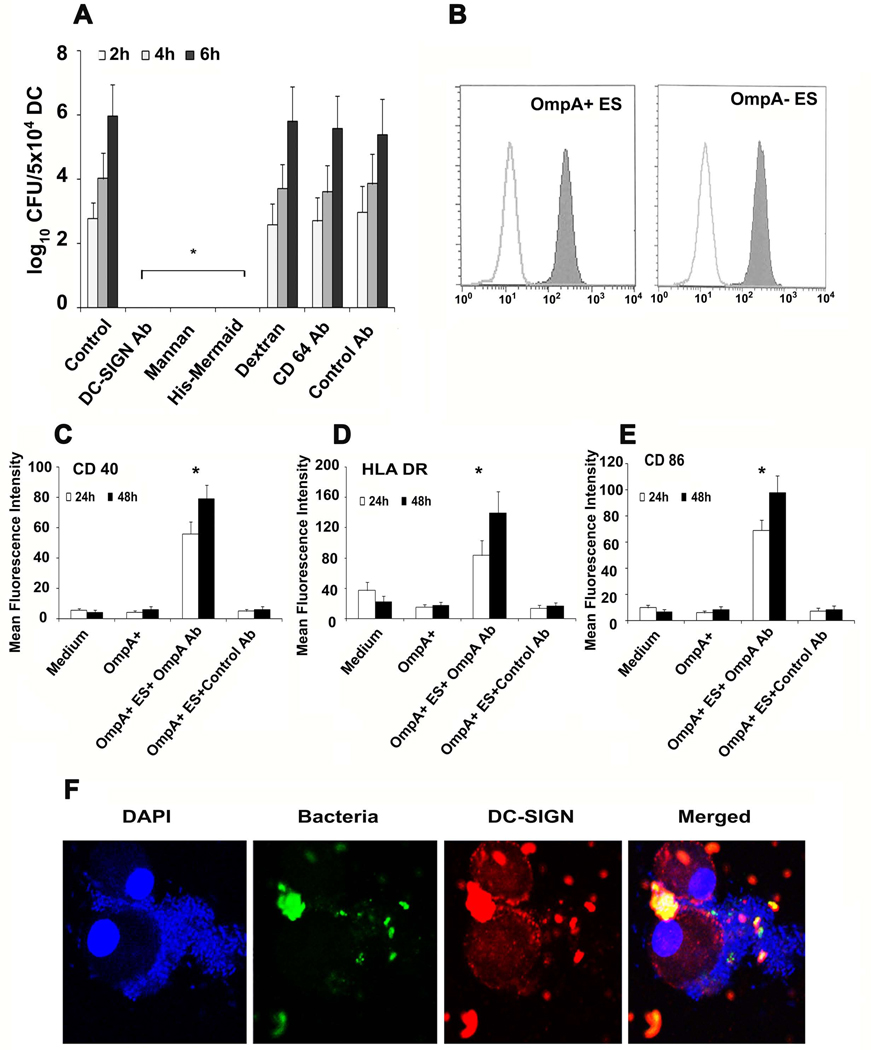
Figure 5. Binding of ES to DC-SIGN.
DCs were incubated with DC-SIGN blocking antibody, mannan, His-Mermaid, dextran, anti-CD64 antibody or control antibody for 1 h prior to incubating with ES. The number of intracellular survival ES was determined as described in materials and methods (A). In separate experiments, ES were treated with 10 µg of His-Mermaid and incubated for 1h, washed and the bound Mermaid was identified by probing with anti-His antibody followed by flow cytometry (B). Similarly, OmpA+ ES were incubated with either anti-OmpA antibodies (20 µl of antiserum with 106 cfu of bacteria) or isotype matched control antibody for 1 h on ice prior to adding to DCs. The expression of CD40, HLA-DR or CD86 was examined by flow cytometry (C–E). Panel F shows confocal microscopy of DCs infected with ES. DCs were co-cultured with GFP OmpA+ or OmpA− ES at an MOI of 10 for 15, 30, 60 and 120 min. The cells were washed, DCs were allowed to adhere to poly L-lysine slides, and then stained with anti-DC-SIGN antibody followed by Cy3 coupled secondary antibody. The slides were counter-stained with DAPI and visualized by confocal laser microscopy. Only data with OmpA+ ES at 60 min postinfection are shown. The error bars represent standard deviations from means of four individual experiments performed in triplicate. The decrease in the number of intracellular ES or increase in the expression of maturation markers was significantly greater in comparison to control, *p<0.001 calculated by Student’s t test.

