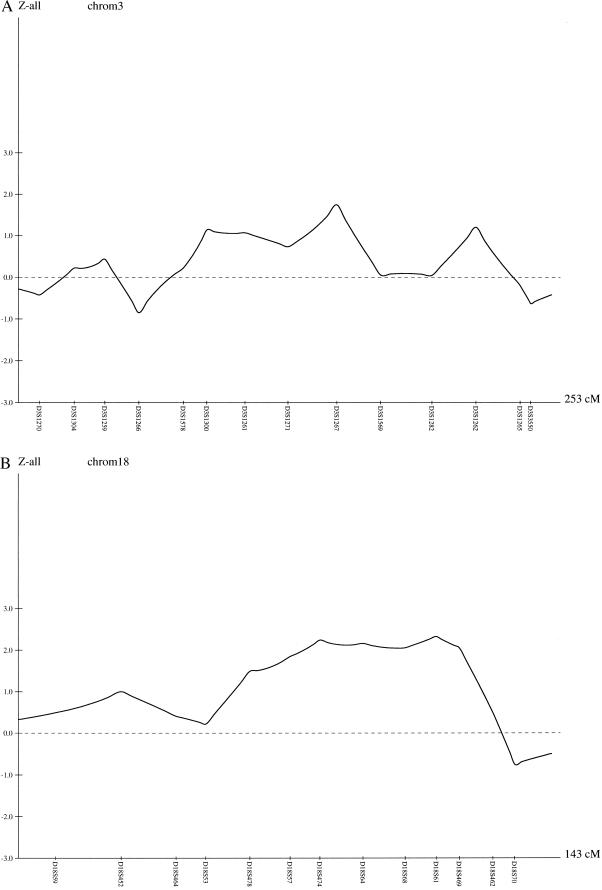
Figure 1.
Multipoint analysis of the chromosomes 3 and 18 scan. The genetic map is plotted on the x axis, and the likelihood ratio score calculated by the genehunter program is plotted on the y axis. The associated linkage P value is reported for the most linked markers in Table 2. The figures for other chromosomes are available on request.

