
Fig 2.
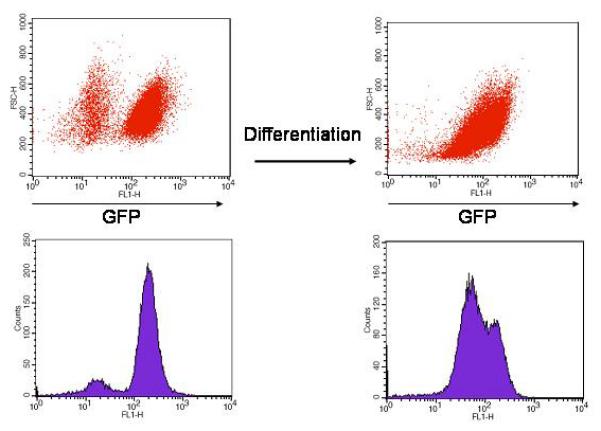
Flow cytometry analysis of GFP-expression in undifferentiated hES-GFP cells (red dot-plot and blue histogram in the left panel) and day 12 EB-derived cells (right panel). The GFP-negative cell population in the undifferentiated cells likely represents the mitotically inactivated human feeder fibroblasts that are used to co-culture the hES cells and do not carry the GFP transgene. Note that in day 12 EB-derived cells a range of GFP intensity is observed suggesting differing levels of transgenic protein expression.