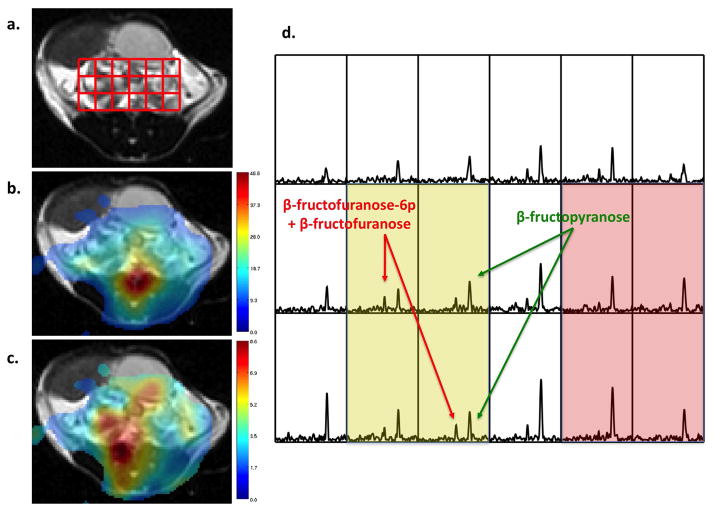
Figure 5.
(a) T2-weighted image of a TRAMP mouse with tumor only on the right side of the prostate. Metabolic images of total hyperpolarized [2-13C] fructose resonances (b) and the composite β-fructofuranose-6-phosphate and β-fructofuranose (c) are shown overlaid on the T2 weighted image. Resonances corresponding to the β-fructopyranose and composite β-fructofuranose-6-phosphate and β-fructofuranose are shown in the corresponding spectral array (d). The yellow area demonstrates a region of tumor, compared to a region of benign prostate tissue in red. An unassigned spurious, low signal-to-noise resonance appears at 115 ppm.

